Tail spend analysis — identifying off-contract purchases with Claude
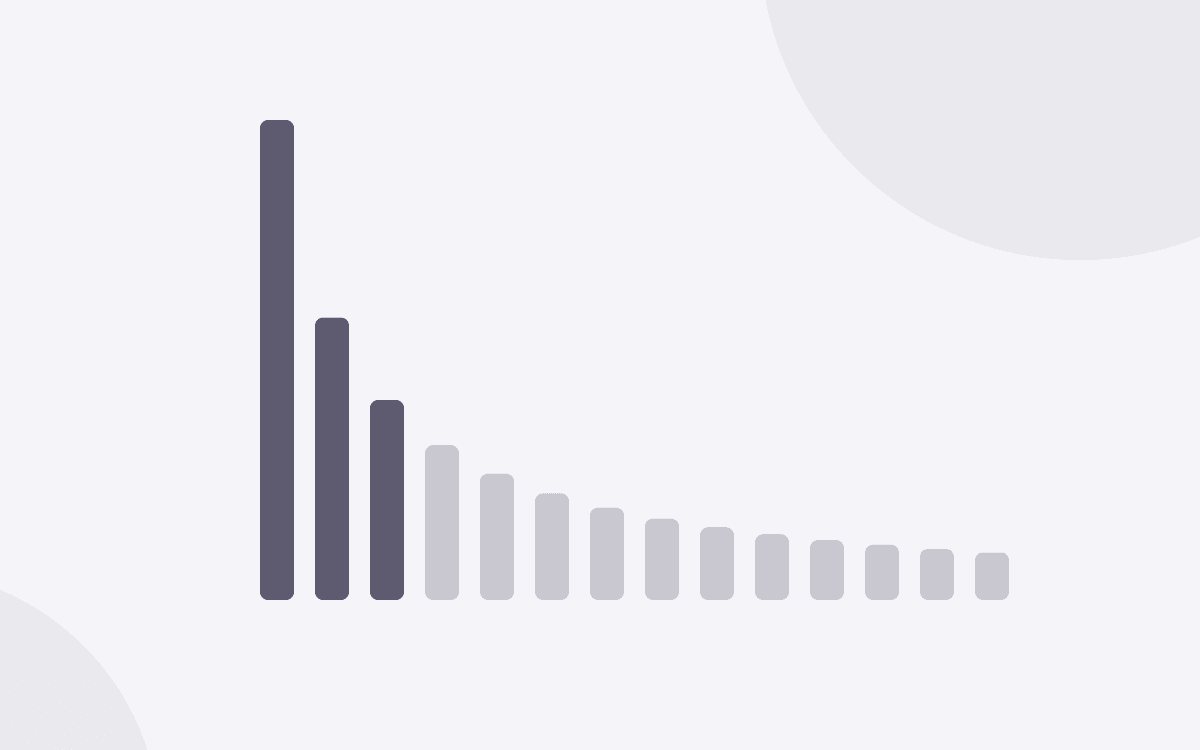
80% of your spend flows through 20% of your suppliers. The rest — tail spend — is procurement's grey zone. Claude analyzes it in seconds and identifies rationalization opportunities.
The problem
Tail spend — purchases scattered across hundreds of small suppliers — represents on average 20% of the procurement budget but 80% of the management effort. This is where duplicates, off-contract purchases, and untapped savings hide.
Identifying tail spend manually requires exporting the entire supplier database, cross-referencing against the approved vendor list, and categorizing anomalies. A job that takes days. With Claude and the Spendesk MCP, it's a conversation.
Tail spend overview
Tail spend analysis — January–June 2026
Overview
Top 10 off-contract suppliers by amount
| Supplier | H1 amount | # transactions | Category |
|---|---|---|---|
| Malt (freelancers) | €18,700 | 7 | HR / Contractors |
| Adobe Creative Cloud | €8,400 | 12 | SaaS Design |
| FNAC Pro | €4,100 | 8 | IT equipment |
| Zoom Pro | €5,200 | 24 | Video — Teams duplicate |
| Uber Eats Business | €3,800 | 31 | Team meals |
| Canva Pro | €2,100 | 18 | SaaS Design |
| Surveymonkey | €1,800 | 6 | SaaS Marketing |
| Amazon.fr (misc) | €6,400 | 47 | Miscellaneous equipment |
| WeWork (day pass) | €3,200 | 15 | Ad hoc office space |
| 235 others | €73,700 | 1,679 | Miscellaneous |
3 optimization opportunities identified
Would you like me to analyze a category in detail?
Investigating maverick spend
Maverick spend refers to purchases that bypass the procurement process. Claude identifies them precisely.
Maverick spend analysis by department — H1 2026
| Department | Purchases with PO | Purchases without PO | % off-process | Off-process amount |
|---|---|---|---|---|
| Marketing | 34 | 89 | 72% | €42,300 |
| Engineering | 67 | 41 | 38% | €28,100 |
| Sales | 22 | 28 | 56% | €18,700 |
| G&A | 18 | 8 | 31% | €6,200 |
| R&D | 41 | 12 | 23% | €9,800 |
Financial impact of maverick spend: €105,100
Supplier concentration analysis
An underestimated risk: over-relying on a single supplier.
Supplier concentration analysis — H1 2026
Top 10 suppliers by spend (% of total)
| Rank | Supplier | H1 spend | % of total | Category |
|---|---|---|---|---|
| 1 | Salesforce | €74,400 | 5.8% | CRM |
| 2 | AWS | €68,200 | 5.3% | Infrastructure |
| 3 | Datadog | €42,600 | 3.3% | Observability |
| 4 | Stripe | €38,900 | 3.0% | Payments |
| 5 | HubSpot | €36,200 | 2.8% | Marketing Automation |
| 6–10 | ... | €124,300 | 9.7% | Miscellaneous |
| Top 10 total | €384,600 | 29.9% |
Concentration index (HHI): 287 — low level, healthy distribution
3 risks identified nonetheless
Key takeaways
- Tail spend is analyzed in seconds, not days
- Claude identifies both anomalies and quantified savings opportunities
- Maverick spend by department helps target the most urgent process training
- Concentration analysis provides a risk view that few procurement teams have today
- All these analyses are conversational: each answer allows you to refine the next question
Related skills
Identify suppliers representing an abnormal share of total spend and assess dependency risk.
Apply Pareto analysis to supplier spend, identify the long tail of micro-suppliers, and surface consolidation opportunities.
Detect out-of-policy purchases made with non-preferred suppliers and measure procurement policy compliance rate.